A popular theme this pre season was parity. Truth be told, it’s been quite popular since the 2014 preseason projections forecasted the smallest disparity between the best and worst teams going back to at least 2005, but the term was so worn-out leading up to this season that BuzzFeed included it on their end of the year list of “words that need to be stricken from the Sabre community” (source needed).
While the AL was the main driver of parity related conversation, it might be worth mentioning that the results show that the AL was more lopsided than in 2015 while the NL’s gap was more compressed compared to the previous season. It’s not that that’s incredible, projection systems are conservative and variables such as sequencing and luck are still unpredictable. Reflections of these points can be seen in Texas’ record in 1 run games, or the Phillies and Braves performing better than they expected, or the Twins performing more like the Phillies and Braves were expected to.
It’s probably reasonable to expect that, as front offices skew more towards advanced analytics, the trend of increased parity will continue. Of course that’s too simple of a statement as revenue sharing and luxury tax measures have played their part in balancing out the competitive environment as well. But as the front offices progresses it’s more likely that the true talent level at the major league level spans a smaller range; less and less at bats go to poor players while the top players are more evenly distributed throughout the league, speaking in terms of true talent.
This article, however, is not really about anything based in analytics or reality and I don’t know how to segue from my intro into delivering to you what I set out to do any better than asking you to assume some ridiculous prerequisites:
- MLB and the owners of all the teams only care about the viewer’s experience and have agreed to form a socialist baseball regime
- Unpredictable variables are now pretty predictable. This includes some luck, breakouts, injuries, rapid declines. This does not mean, however, that Runs and RBIs are predictable, it just works out perfectly by WAR
- The public is unaware of the predictability of baseball and there is an illuminati type presence in baseball headed by a board of trustees that includes, ironically, but obviously, Joe Morgan
- Payrolls are dictated by the outcomes that MLB knows will happen and are strictly performance based – by Fangraphs WAR
- Rosters are reconstructed every single year
- Reconstructing rosters has no effect on luck or sequencing or ball park effects (maybe all ball parks have the same dimensions
- The DH is in both leagues but is only reserved for a portion of games throughout the year; teams are required to allocate at least 140 PA to pitchers
- Dave Stewart somehow managed to mess up his last season as the Diamondbacks GM (They just happened to be the last team I constructed and there wasn’t enough WAR left to make them as good as the other teams)
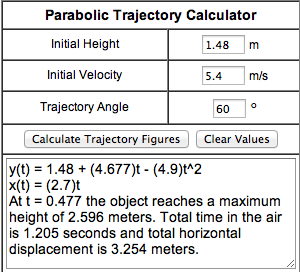
What I did was export all the data I felt was relevant from the Leaderboards and built 30 rosters based on the average number of Plate Appearances, Games Started, Innings Pitched, and WAR. The numbers for the league break down like this:
Offense
PA (Non Pitchers): 179,218 (5,974.93/team)
WAR (Non Pitchers): 572 (19.07/team)
PA (Pitchers): 5,366 (178.87/team)
WAR (Pitchers): -2.6 (-0.09/team)
Pitching
GS: 4856 (161.87/team)
IP: 43306.3 (1443.54/team)
WAR: 429.5 (14.32/team)
The only other things I wanted to be consistent with reality were the distribution of Plate Appearances by position and accounting for the IP by position players. The first caveat doesn’t work out perfectly, but you’re not going to find a team that received 1,500 PA from their catchers and only 900 from all three outfield positions combined. The second one, however, I believe I perfected.
After I had built the 30 rosters I realized they were only distinguished by a roster number, so in order to assign each roster a team, I simply took an alphabetical list of the team names and went down one by one with a random number generator and matched that team and random number to the roster with the corresponding number.
When you look at these rosters ask yourself a few things: Who was on your favorite team? Considering the public doesn’t know about the basically flawless projection systems, how did your team do compared to how you thought they would do? How much would this effect the way you watch the game? How much would this affect your team loyalty? Would you enjoy this? Is this the dumbest exercise you’ve ever seen?


 JOSE BAUTISTA
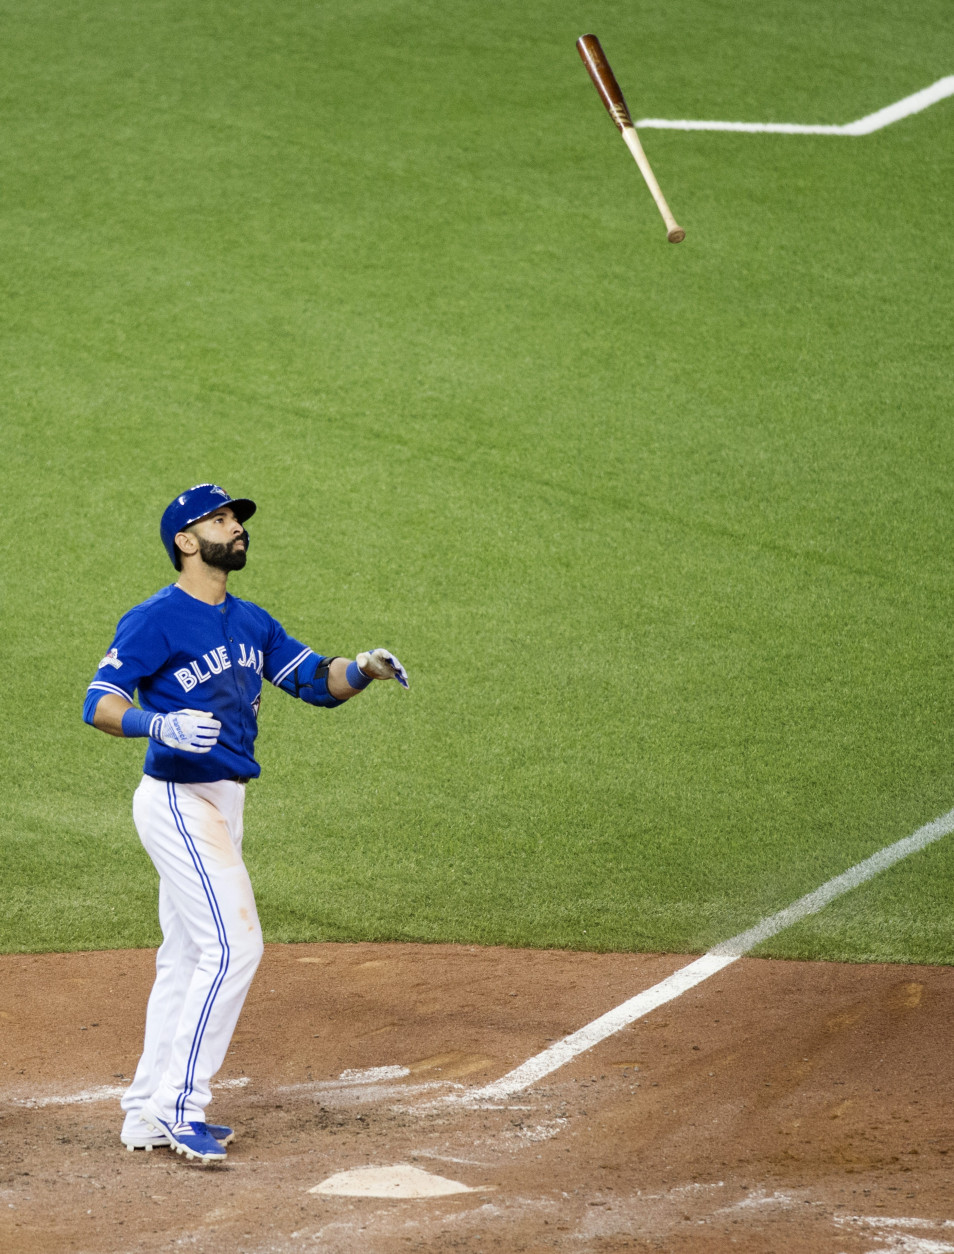


 YOENIS CESPEDES